We are thrilled to officially announce that geoBoundaries 4.0, the fourth installment of the geoBoundaries project, is finally here. The geoBoundaries project began in 2018 as a way to create open-source and standardize boundary data, and the project has only grown from there. geoBoundaries 1.0 came out in 2018, and marked geoBoundaries and the geoLab as an emerging project for NGOs and consultant partners to keep track of as it expanded. Version 2.0 came out in early 2020, followed by 3.0 in late Spring 2020. We released the much anticipated 4.0 update on August 31st, 2021. Now, the geoBoundaries organization has 17 members and is a staple research project out of the geoLab at the College of William & Mary in Williamsburg, Virginia.
This update includes over 500 boundaries with several new digitizations. It also includes several boundaries digitized by students that were not available in previous releases. In total, the undergraduates working in the geoLab submitted hundreds of new pieces of boundary data from Spring 2020 to Summer 2021. The undergraduates who submitted to the project are: Lindsey Rogers (‘21, now a CGA fellow at W&M), Joshua Habib (‘21), Sidonie Horn (‘22), Sean Murphy (‘22), Dorian Miller (‘22), Hadley Day (‘23), Lydia Troup (‘23) Dominic Fornatora (‘23), Natalie Spage (‘23), Kristina Pupkiewicz (‘23), Michael Roth (‘23), Caro Rivera (‘23), Charlie Altman (‘22), Isabel Schruer (‘23), Tara McLaughlin, Russ Biddle (‘23), Renee Ritchey (‘24), Emily Topness (‘22), James Turner (‘23), Sam Updike (‘22), Helena Buckman (‘23), Neel Simpson (‘22), Jason Lin (‘22), Sylvia Shea (‘21), and Sydney Fuhrig (‘21).
geoBoundaries is largely staffed and managed by undergraduate students. In the 2020-2021 school year, Sylvia Shea (‘21) and Sydney Fuhrig (‘21) led the project. This year, Lydia Troup (‘23) and Sean Murphy (‘22) transitioned into the co-leadership positions. Team co-lead Sean says “The opportunities for student leadership are unparalleled in other student organizations. We’ve gained skills in human resource management, communication with external partners, and problem solving that can only be learned in practice, not in a classroom.”
For the first time, researchers uploaded their boundaries through a GitHub site. The GitHub sites, designed by Dan Runfola, aimed to streamline and standardize the review process for boundary data. The new website has improved the quality and speed of data collection, and allowed for external research to contribute to our dataset. Lydia Troup (‘23), an undergraduate researcher who worked on the GitHub site, and geoBoundaries co-lead, says “we went from submitting files on a spreadsheet to having a fully functional bot auto-checking each file. The convenience and speed are gamechangers. The system exposes students to a workflow similar to what they will encounter in professional post-graduate settings.”
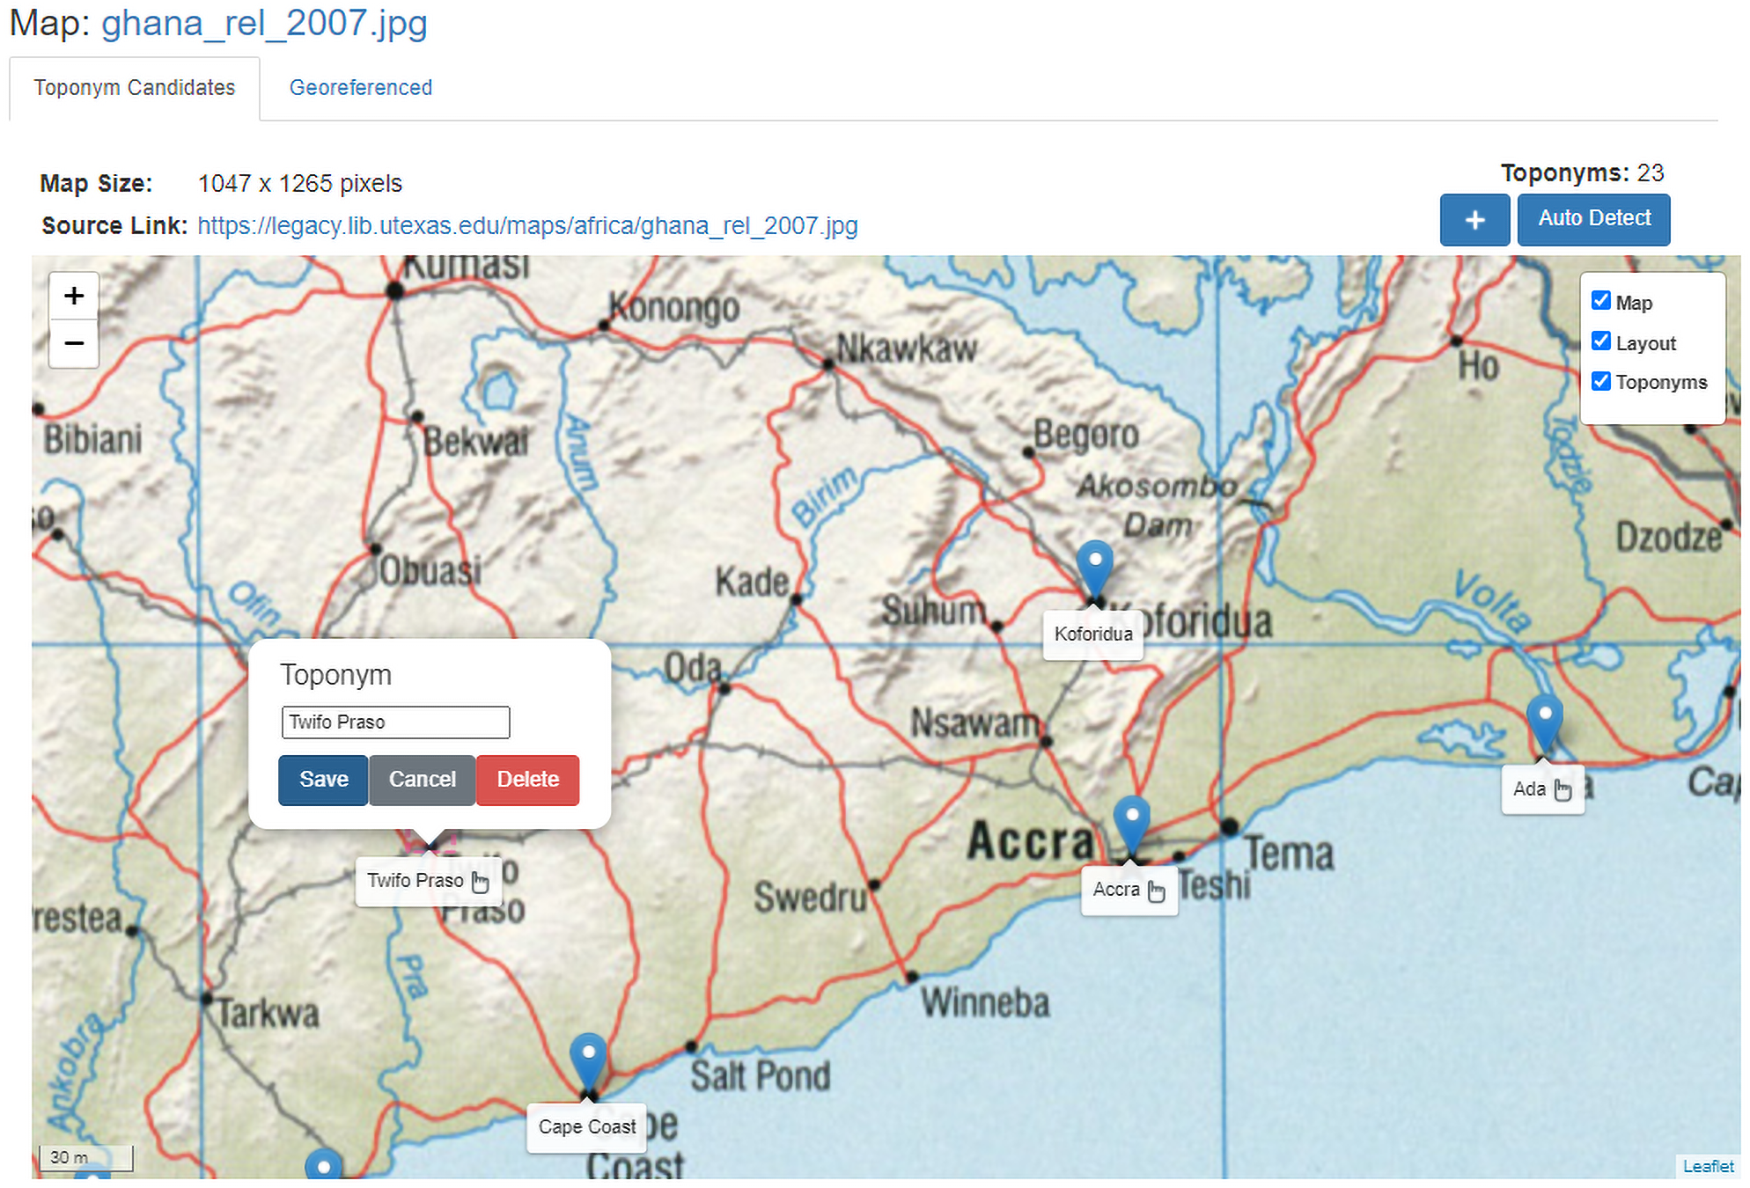
Boundary data not available online had to be created by hand by undergraduate researchers. Manually digitizing proved challenging but satisfying to student researchers who undertook the task. One student, Renee Ritchey (‘24), digitized several boundaries for 4.0 including Nauru (NRU1), Uruguay (URY2), the Solomon Islands (SLB3), and Latvia (LVA2). Renee described digitizing, saying “When I sit down to digitize, I have a base map open and an overlaid image. Then I manually plot points on the map to match up the reference image.” This process can take dozens of hours depending on how complicated the boundaries are. Despite these challenges, Renee describes the importance of creating these files saying “there are a lot of limitations in licensing, so by putting it in our format, we create a source where anyone can do open analysis with these boundaries.” At geoBoundaries, we believe that it is crucial that academics, researchers, and civilians alike have access to this boundary data without restriction. Ultimately, we hope to improve our field by producing data that is more open and accessible to everyone.
Researchers also created the Humanitarian and Authoritative data sets. The authoritative sets come from the UN SALB databases, and the authoritative data sets contain the boundaries as provided by countries themselves. The opportunity to study authoritative boundary datasets has expanded students’ understanding of boundary conflict. Hadley Day (‘23) says “Authoritarian data sets are created by governments, so that is where the most border disputes become evident because we often have areas that are ‘double-mapped’. This process allowed me to see more clearly what kinds of territories are disputed, and allowed us to create theories on why some land is considered more valuable than others.”
Alternatively, the humanitarian data sets come from NGOs like HDX or HumData which are generally used for aid work. Hadley also offered commentary on the new humanitarian boundaries. “It is also powerful to come to terms with how and why these groups create humanitarian data sets because often they are in response to serious crises that require NGO interventions. Oftentimes, these data sets are dated which can lead to less accurate crisis analysis. I hope that more funding can be provided to these critical mapping organizations in the future so they have the resources to make frequent updates to their data.”
Overall, the geoLab provides unique opportunities to lead, research, and publish, that are otherwise difficult to find in undergraduate settings. Students build technical skills with data analysis and GIS, and enhance their understanding of border conflicts across the world. The Lab gives students the opportunity to work directly with external partners like ESRI, the UN, and the WHO, setting students up for success upon graduation with workforce skills one cannot learn in a classroom setting. Ultimately, the geoLab provides students with excellent research opportunities and in turn those students provide deeply needed research to the field. With that, we are so excited to bring you, finally, geoBoundaries 4.0.
The geoBoundaries 4.0 data can be found on the geoBoundaries website and on the Harvard Dataverse. The corresponding article can be found on PLOS One.
